Simple algorithms handling large-ish data sets tend to be pretty. However, the results aren’t necessarily intuitive for sifting through with REPL and Lisp inspector, and dedicated visualization tools come handy.
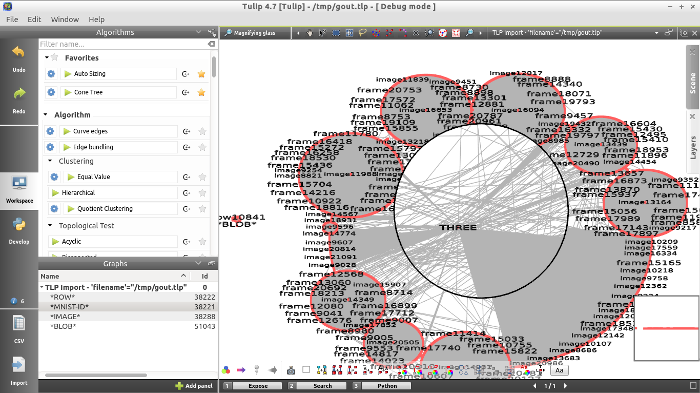
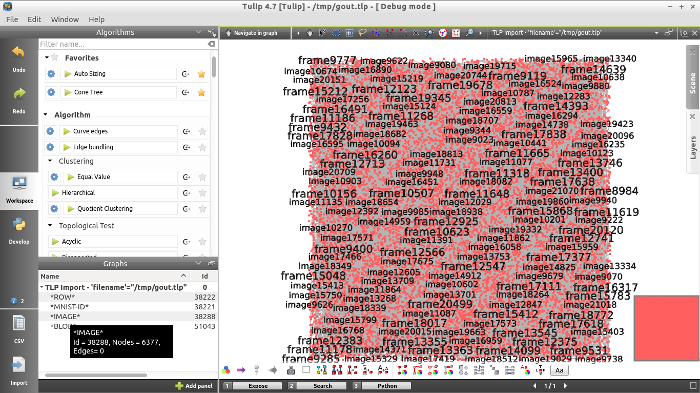
For sizable graphs I settled with Tulip, a powerful and comprehensive tool for juggling around massive (hundreds of thousands nodes) data sets. One can conveniently pan, rotate and zoom the graph, limit the visibility to specific clusters. It is possible to run a wide range of ordering, manipulating and testing algorithms as well.
I came up with cl-tulip-graph (formerly Bouquet) for quickly blueprinting a .tlp graph of a Lisp data structure. The README explains its use, but here’s a real-life sample of generation. It generates a graph for the internal state of a computationalist pattern matcher; the particular structural details are unimportant here.
1
2
3
4
5
6
7
8
9
10
11
12
13
14
15
16
17
18
19
20
21
22
23
24
25
26
(defun render-graph (&optional (filename *standard-output*))
    (bouquet:new-graph)
  (loop for entry in (append '(zero one two three four five six seven eight nine
		     *mnist-id* *row* *image* *blob*
		     dark light)
		      *universum*) do
       (bouquet:register-node entry)
       (bouquet:label (bouquet:node entry) entry))
  (loop for entry in '(*mnist-id* *row* *image* *blob*)
     do
       (bouquet:make-cluster (symbol-name entry))
       (loop for rec = (symbol-plist entry) then (cddr rec)
	  for ctxt = (first rec)
	  for links = (second rec)
	  while rec do
	    (bouquet:add-to-cluster
	     (bouquet:cluster (symbol-name entry))
	     (bouquet:node ctxt))
	    (loop for r in links do
	    (bouquet:register-edge
	      (bouquet:node ctxt)
	      (bouquet:node r)))))
  (with-open-file (f filename :direction :output
		     :if-exists :overwrite
		     :if-does-not-exist :create)
			 (bouquet:render-graph f)))
After the graph initialziation, the loop on line 3 through 8 sets up all the nodes with labels. The next loop sets up a bunch of clusters and adding the edges between the nodes. The graph is rendered into file stream on the last line.
This trihobeozar of a graph rendered nicely via Cone Tree layout: